


Introduction
Managing network infrastructure across multiple locations can be challenging. Whether you’re an IT administrator monitoring office branches, a system engineer tracking data center equipment, or an MSP managing client networks, you need a reliable way to keep tabs on your devices.

Today, I’m excited to share a free, open-source network monitoring solution that I’ve developed to solve this exact problem. This system combines real-time device monitoring with an intuitive configuration panel, all wrapped in a modern, dark-themed interface.
What is This System?
This is a PHP-based network monitoring dashboard that provides:
✅ Real-time device status monitoring via ICMP ping
✅ Web-based configuration panel – no code editing required
✅ Multi-location support – perfect for distributed infrastructure
✅ Beautiful dark-themed UI with smooth animations
✅ Zero database requirement – uses simple JSON storage
✅ Export/Import functionality – easy deployment across teams
Key Features
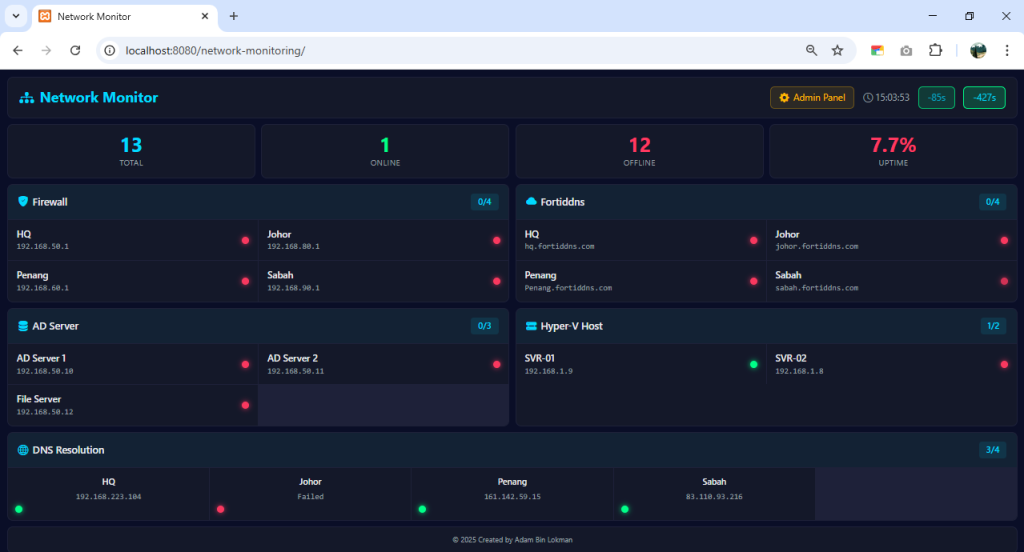
📊 Real-Time Monitoring Dashboard
The main dashboard gives you an instant overview of your entire network:
- Live Device Status: Visual indicators show which devices are online (green) or offline (red with blinking animation)
- Automatic Refresh: Devices checked every 10 seconds, DNS resolution every 5 seconds
- Statistics Panel:
- Total devices count
- Online devices
- Offline devices
- Network uptime percentage
- Multiple Device Categories:
- Firewalls
- FortiDDNS hosts
- AD Servers
- Hyper-V Hosts
- Custom device groups
- DNS Resolution Monitoring: Track FortiDDNS hostnames and their resolved public IPs
- Responsive Design: Works seamlessly on desktop, tablet, and mobile
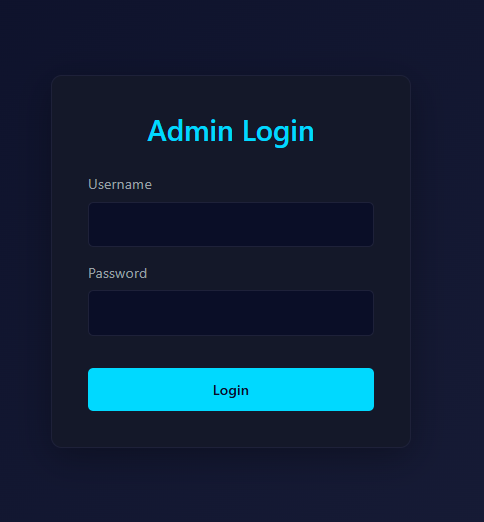
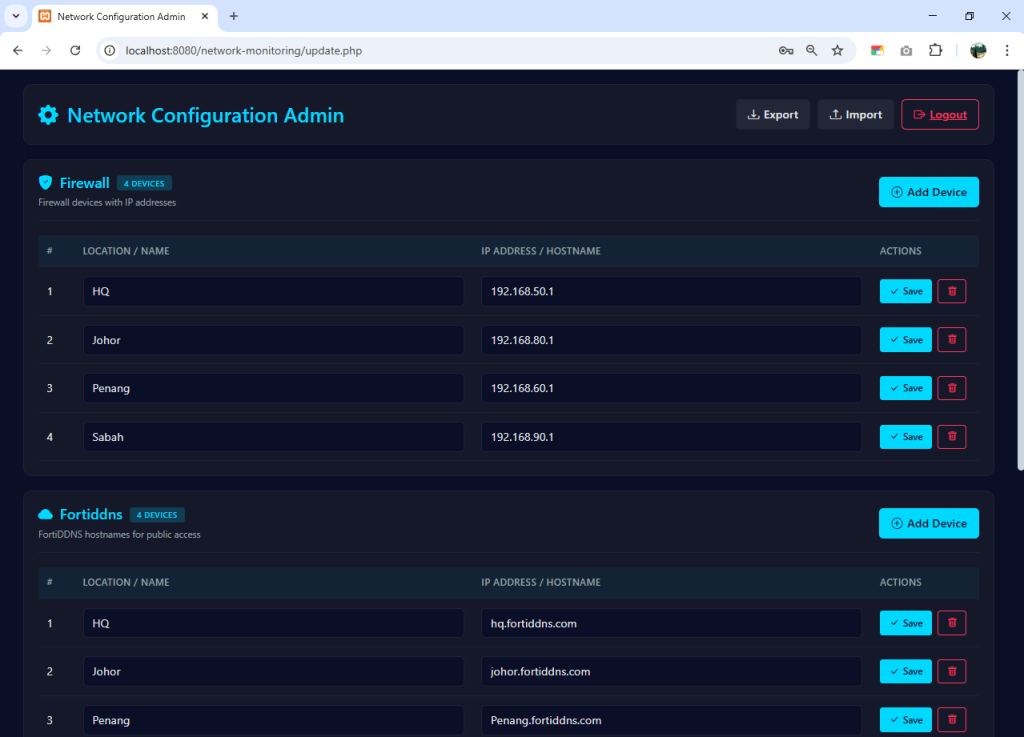
⚙️ Configuration Admin Panel
No more editing PHP code! The admin panel provides:
- Secure Login System: Password-protected access to configuration
- Add Devices: Simple form to add new devices with location and IP/hostname
- Edit Devices: Modify device information directly in the interface
- Delete Devices: Remove devices with confirmation dialog
- Export Configuration: Download your setup as JSON for backup or sharing
- Import Configuration: Upload configurations from other environments
- Real-Time Updates: Changes reflect immediately on the dashboard
- User-Friendly Interface: Clean, intuitive design matching the dashboard theme
Screenshots
Main Monitoring Dashboard
Admin Configuration Panel
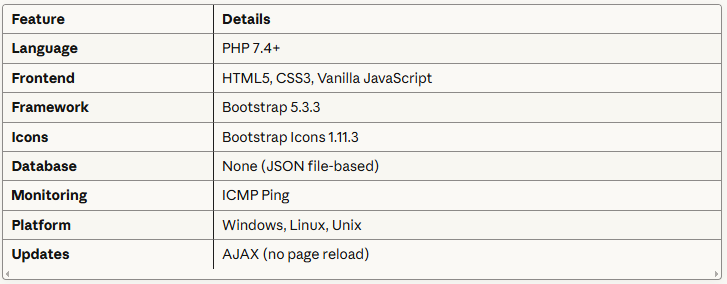
Technical Specifications
Use Cases
1. Multi-Branch Organizations
Monitor network devices across headquarters and branch offices from a single dashboard.
2. Managed Service Providers (MSPs)
Deploy customized dashboards for each client with their specific infrastructure.
3. Data Centers
Track server status, network equipment, and critical infrastructure in real-time.
4. IT Teams
Share configurations between team members and monitor distributed systems.
5. Home Labs
Perfect for tech enthusiasts managing home networks and lab environments.
Installation Guide
Option 1: Install on XAMPP (Local Testing)
Perfect for testing or home lab use.
Step 1: Download and Install XAMPP
- Download XAMPP from https://www.apachefriends.org
- Install XAMPP (default:
C:\xamppon Windows) - Start Apache from XAMPP Control Panel
Step 2: Deploy the Files
- Navigate to XAMPP’s web directory:
- Windows:
C:\xampp\htdocs\ - Mac/Linux:
/Applications/XAMPP/htdocs/or/opt/lampp/htdocs/
- Windows:
- Create a new folder:
network-monitor - Download and copy both files:
index.php(Main Dashboard)update.php(Admin Panel)
Step 3: Access the System
- Open your web browser
- Main Dashboard:
http://localhost/network-monitor/index.php - Admin Panel:
http://localhost/network-monitor/update.php - Login with:
- Username:
admin - Password:
admin123
- Username:
Step 4: Start Monitoring
- Login to the admin panel
- Add your network devices
- View real-time monitoring on the main dashboard
How to Use
First-Time Setup
- Access Admin Panel
- Go to
update.php - Login with default credentials
- Go to
- Add Your First Device
- Click “Add Device” button
- Enter Location (e.g., “HQ”, “Branch Office”)
- Enter IP Address or Hostname
- Click “Add”
- View Dashboard
- Return to
index.php - See your device status in real-time
- Return to
Managing Devices
Add Device:
- Click “Add Device” in any category
- Fill in Location and IP/Hostname
- Click “Add”
Edit Device:
- Change values directly in the table
- Click “Save” button
Delete Device:
- Click trash icon
- Confirm deletion
Export/Import Configuration
Export:
- Click “Export” button
- Copy JSON configuration
- Save to file or share with team
Import:
- Click “Import” button
- Paste JSON configuration
- Click “Import Configuration”
![]()